Drew An-Pham
Collection of my GIScience Work
RE- Spatial-temporal and content analysis of Twitter Data
Replication of
Spatial, temporal and content analysis of Twitter data
Original study by Wang, Z., X. Ye, and M. H. Tsou. 2016. Spatial, temporal, and content analysis of Twitter for wildfire hazards. Natural Hazards 83 (1):523–540. DOI:10.1007/s11069-016-2329-6. and First replication study by Holler, J. 2021 (in preparation). Hurricane Dorian vs Sharpie Pen: an empirical test of social amplification of risk on social media.
Replication Author: Drew An-Pham
Replication Materials Available at: RE-Dorian Repository
Created: 10 May 2021
Revised: 12 May 2021
Abstract
In a digital economy where data is the new currency of knowledge, crowd-sourced/volunteered geographic information (VGI) such as Twitter data has become a powerful utility for approaching spatial inquiries. As such, studying the spatial distribution of Twitter data has presented the opportunity to investigate the dissemination, temporal, and content patterns for current and past events (i.e. natural disasters, the 2020 election results, the colonial pipeline breach, etc), furthering the pool for geospatial research.
In Wang et al’s (2016) analysis of Twitter data for wildfires in California, they found that social media data was a valuable asset for enhancing situational awareness and aiding disaster management during wildfire hazards. In this specific case study, Twitter served as an avenue for relaying evacuation warnings, communicating geographic updates about the wildfires, and sharing wildfire-related information with the general public. On a broader note, despite the limitations and ethical uncertainties of using Twitter data in research (Crawford & Finn, 2015), Wang et al’s (2016) findings show the potential Twitter data has to ground and characterize natural hazards across spatial, temporal, and content domains.
More recently, Holler (2021) is studying Twitter data for Hurricane Dorian on the Atlantic coast, finding that in spite of trending news and social media content regarding a false narrative of risk, original Tweets still clustered significantly along the real hurricane track, and only along the hurricane track.
Reproducing and replicating spatial research of crowd-sourced/volunteered geographic information (VGI) continues to be relevant because social media (i.e. Twitter) and other mediums for collecting VGI (i.e. OpenStreetMap) have begun to move towards the forefront of communicating and contextualizing ‘critical and defining’ events, capitalizing on the informative power of the public. With the changing dynamics of our digital landscape, the stock of VGI is continually in flux/not static—meaning that while the reproduction of spatial research isn’t always guaranteed, the replication of spatial research using VGI such as Wang et al (2016) via Twitter search API can help expand geospatial knowledge across different time frames and contexts.
In this replication study, I will analyze the spatial distribution of COVID-19 vaccination Tweets in the South (defined by a 40,000 respondent survey done by Vox) from May 2nd, 2021 to May 10th, 2021. Given the United State’s worst vaccination rates are clustered in the South—with Alabama, Mississippi, & Louisiana lagging behind primarily (Chatlani, 2021)—I am curious as to whether these states will have ‘cold spots’ of Twitter activity, or if any anti-vaccination sentiments will be detected in these places based on content analysis.
Original Study Information
Wang et al’s (2016) original study sourced data from Twitter search API using a two phase collection process. The first phase compiled Tweets that contained either “fire” or “wildfire,” while the second phase extracted wildfire tweets pertaining to specific locations—San Marcos and Bernardo. Temporally, the Tweets used spanned from May 13 2013 to May 22, 2014, indicative of the first wildfire occurrence and the point at which the most destructive wildfires were contained. After Tweets were collected, Wang et al (2016) used the tm package in R 3.1.2 for text mining: a way to identify significant term/term clusters in Tweets. In this process, unnecessary ‘noise’ such as the URLs and stop words were cleaned out from the raw Tweets, then a k-means clustering method was applied to find term clusters—terms commonly occurred in Tweets together. This first part of Wang et al’s (2016) content analysis found that the main topics of wildfire-related Twitter conversations revealed geographic awareness during wildfire events, user concern with wildfire response, and an appreciation for firefighters’ frontline work.
Similarly, the igraph package in R was used to conduct a social network analysis, detecting how users’ spread and absorb information based on retweet activity. In the case of the Californian wildfires, this analysis highlighted the prevalence of government and local news media in disseminating reliable information during disasters—indicated by a high indegree of their nodes. As such, these findings also revealed the polarized structure of these retweet networks, where a handful of ‘influential’ users would serve as the hubs of information exchange, with the remaining Twitter-scape (less influential users) lacking both indegree (getting retweeted) and outdegree (retweeting) of their nodes.
Deviating from content analysis, dual kernel density estimation (KDE) was used to visualize hotspots of the specific wildfire Tweets for Bernardo and San Marcos fire, taking to account the impact of population. These deliverables helped identify impact areas, as well as emphasizing the spatial patterns of Tweets across the region. For example, San Diego was large hotspot for Twitter activity, however, wasn’t densely populated with Tweet clusters related to Bernardo fire and Cocos fire, as it wasn’t in close proximity to the wildfires’ ignition location. It is not known what GIS software was used to execute this spatial analysis.
Likewise, Holler (2021) loosely replicated the methods of Wang et al (2016) for the case of Hurricane Dorian’s landfall on the U.S. mainland during the 2019 Atlantic Hurricane season. Holler modified Wang et al’s methods by not searching for retweets for network analysis, focusing instead on original Tweet content with keywords hurricane, Dorian, or sharpiegate (a trending hashtag referring to the storm). Holler modified the methodology for normalizing Tweet data by creating a normalized Tweet difference index (NDTI) and extended the methodology to test for spatial clustering with the local Getis-Ord statistic. The NDTI used incorporated the formula (Dorian-related Tweet activity - expected Tweet activity)/(Dorian-related Tweet activity + expected Tweet activity) and was based on other normalized indices such as the normalized difference vegetation index (NDVI), which estimates the green/vegetation density of remotely sensed images using the formula (NIR - VIS)/(NIR + VIS), where NIR is near-infrared radiation and VIS is visible radiation (NASA, 2000). The study tested a hypothesis that false narratives of hurricane risk promulgated at the highest levels of the United States government would significantly distort the geographic distribution of Twitter activity related to the hurricane and its impacts, finding that original Twitter data still clustered only in the affected areas of the Atlantic coast in spite of false narratives about risk of a westward track through Alabama.
The replication study by Holler (2021) used R, including the rtweet, rehydratoR, igraph, sf, and spdep packages for analysis.
Materials and Procedure
The data collection and analysis for this replication used the same methodology as Holler’s (2021) case study, adjusting for parameters pertaining to my focus topic—visualizing the spatial distribution of COVID-19 vaccination Tweets in the South. In order to access the data from Twitter’s search API, a Twitter Developer account is required, which is free. There are premium upgrades that allow one to queue and access more Tweets across a larger time scale, however, for the sake of accessibility, a standard developer account was used.
My Twitter API search was conducted on May 10, 2021, indicative of a time where COVID-19 vaccine availability and vaccination appointments had started to become more readily available, yet the New York Times’ Vaccination Map showed a lack of vaccinations throughout southern states compared to the Northeast. I searched for Tweets containing the keywords “vaccine,” “appointment,” or “vaccination” that were within 1,000 miles of Houston, Texas (29.76,-95.37). This query yielded 206,702 initial Tweets and 4,985 Tweets after filtering (~2.5% of my sample size had geographic information). As well, baseline data on Twitter activity was procured to calculate a normalized difference Tweet index (NDTI) and act as a comparison point for vaccination Tweets, yielding 13,248 Tweets after filtering. The R-Studio script used to preprocess data can be found here, and the collection of Tweet ID numbers can be found here: vaccination Tweets, baseline Tweets.
After preprocessing, analyses across different dimensions (temporal, network, text/contextual, and spatial) were ran using a modified R-Studio script based on Holler’s (2021) R code in his Dorian analysis. This script produced figures 1, 2, 3, & 4. Lastly, a final R-Studio script was ran to map hotspots of Twitter activity. A spatial join was used to join both vaccination and baseline Tweets to counties, then Getis and Ord’s (1995) G-statistic was applied to compare the NDTI—defined by Holler (2021) as NDTI = (south - baseline) / (south + baseline) & coded by Casey Lilley (2019)—to COVID-19 vaccination Tweets across the South using a nearest-neighbor analysis. The final results of this script can be seen in figure 5, highlighting counties that had statistically significant hot and cold spots of vaccination Twitter activity.
Replication Results
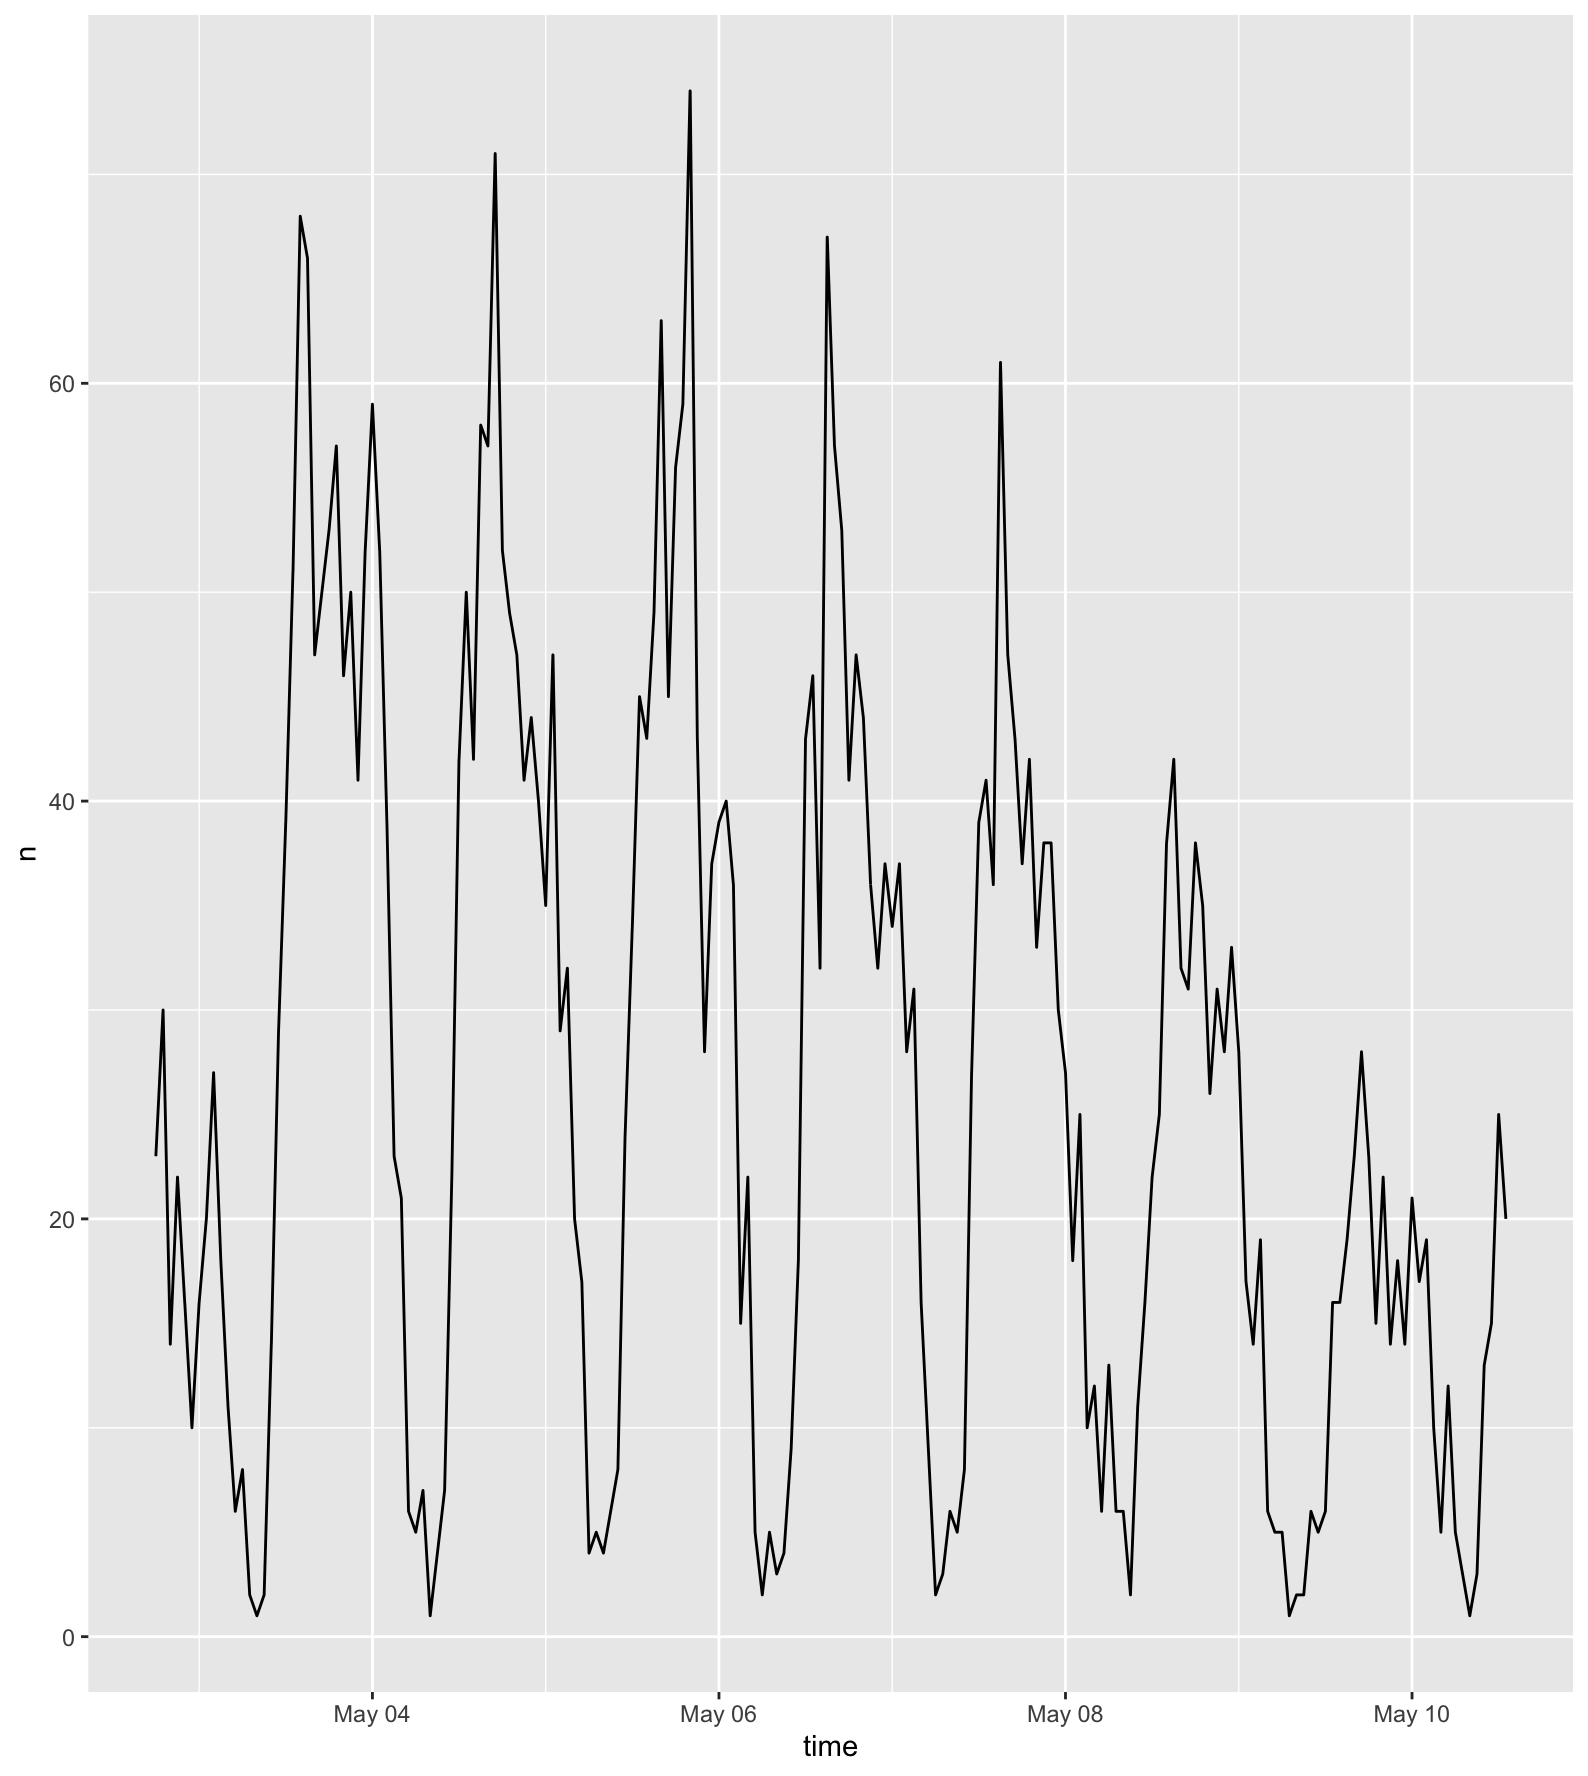 figure 1. Number of vaccination related Tweets with geo-data by day during the study period
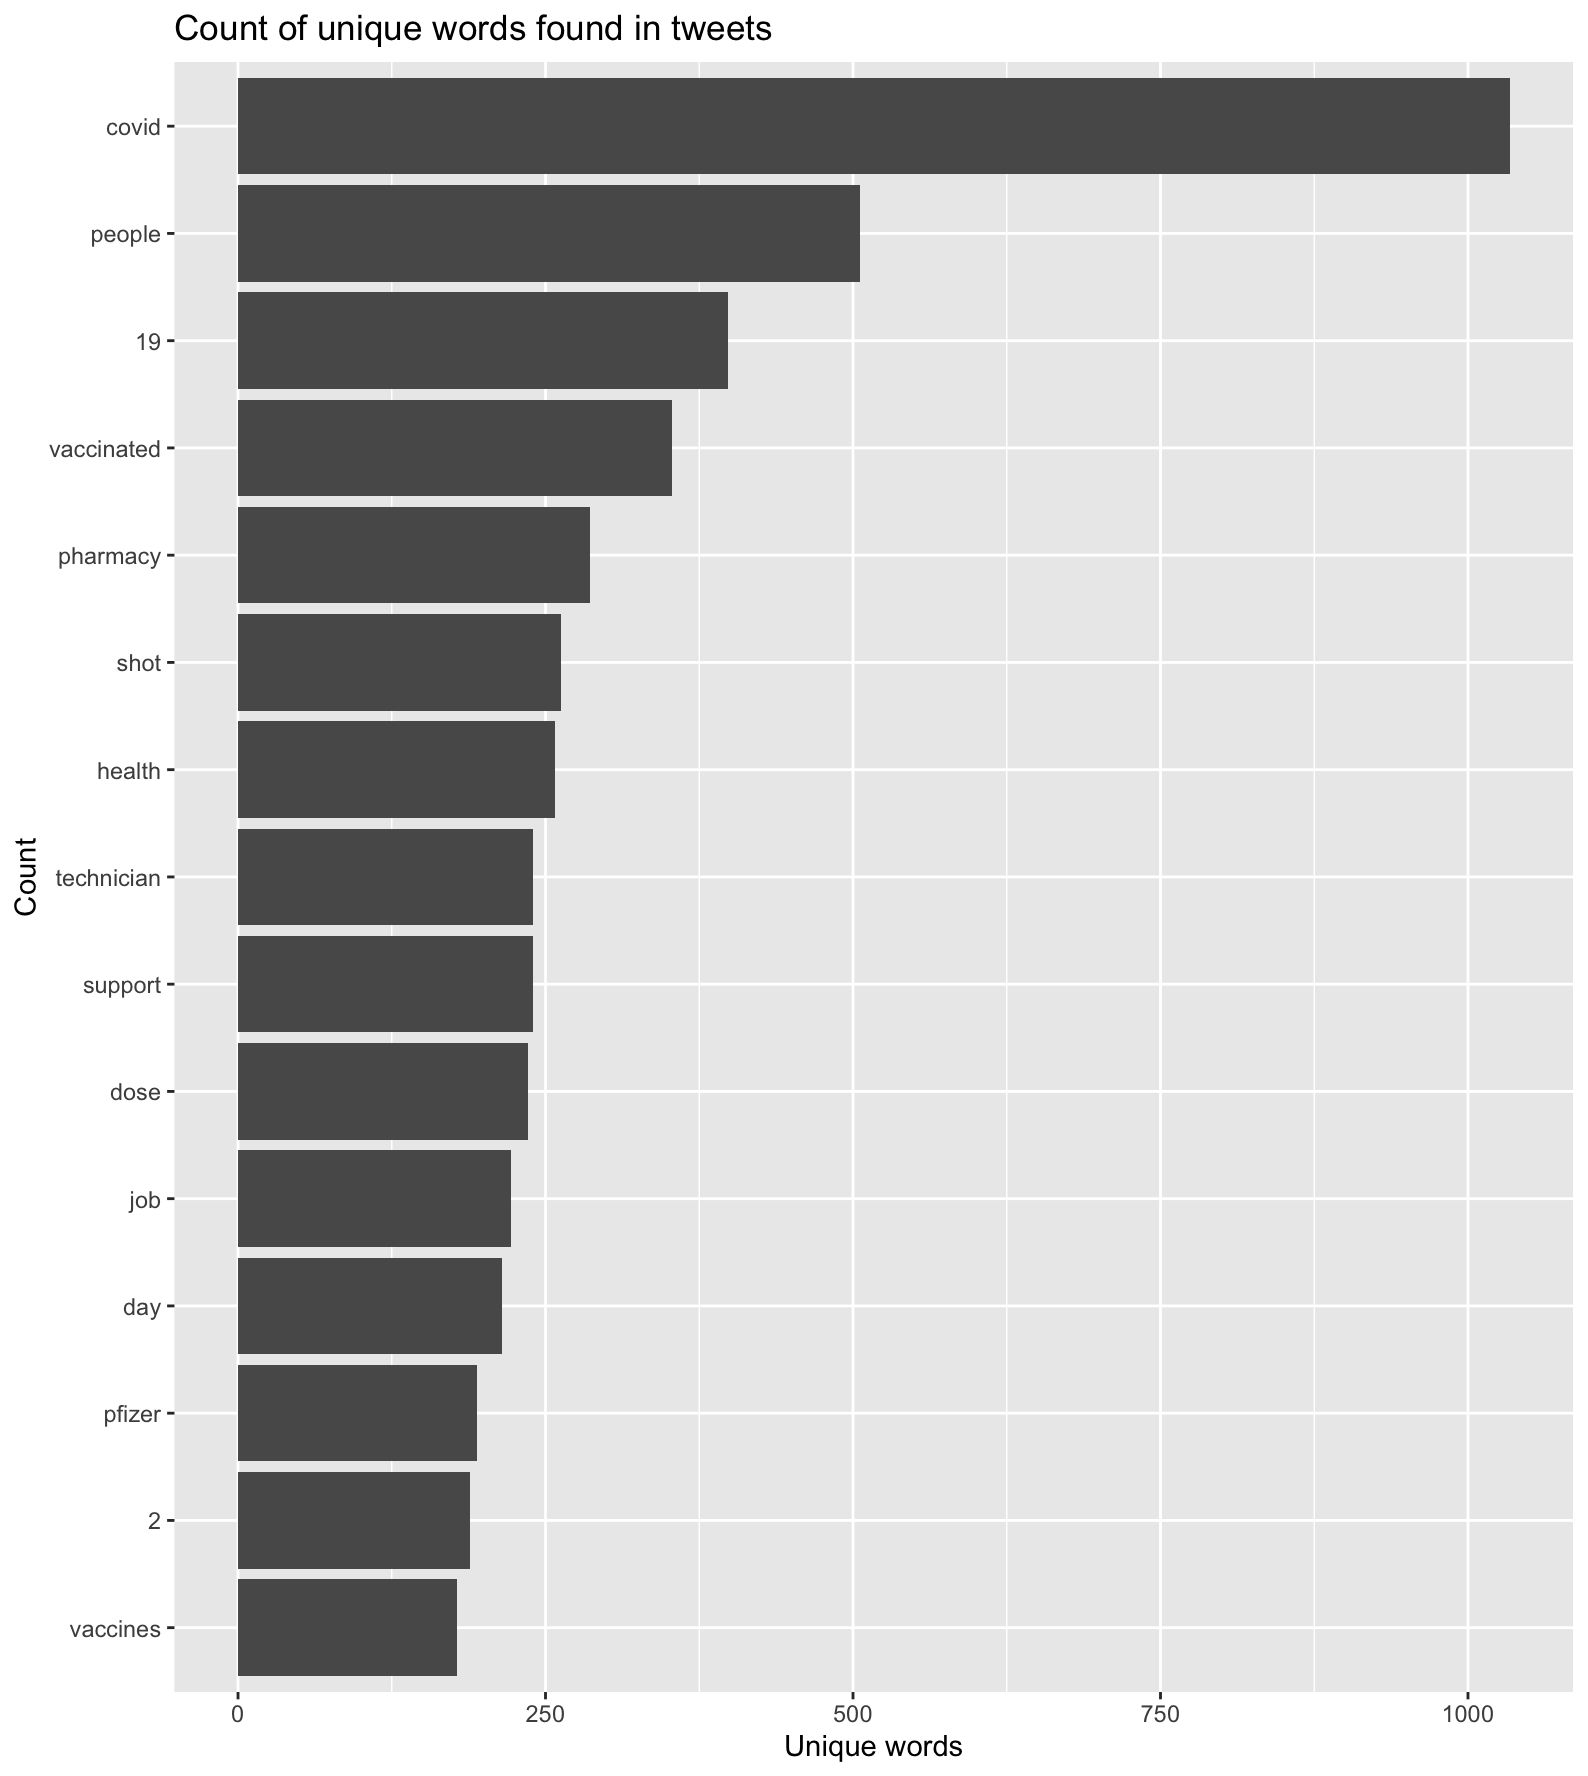 figure 2. Most common words found in COVID-19 vaccination Tweets by frequency of occurrence
NOTE: “COVID” & “19” weren’t made stop words, since I wanted to see if this phrase was found with vaccination, vaccine, and appointment in Tweets*
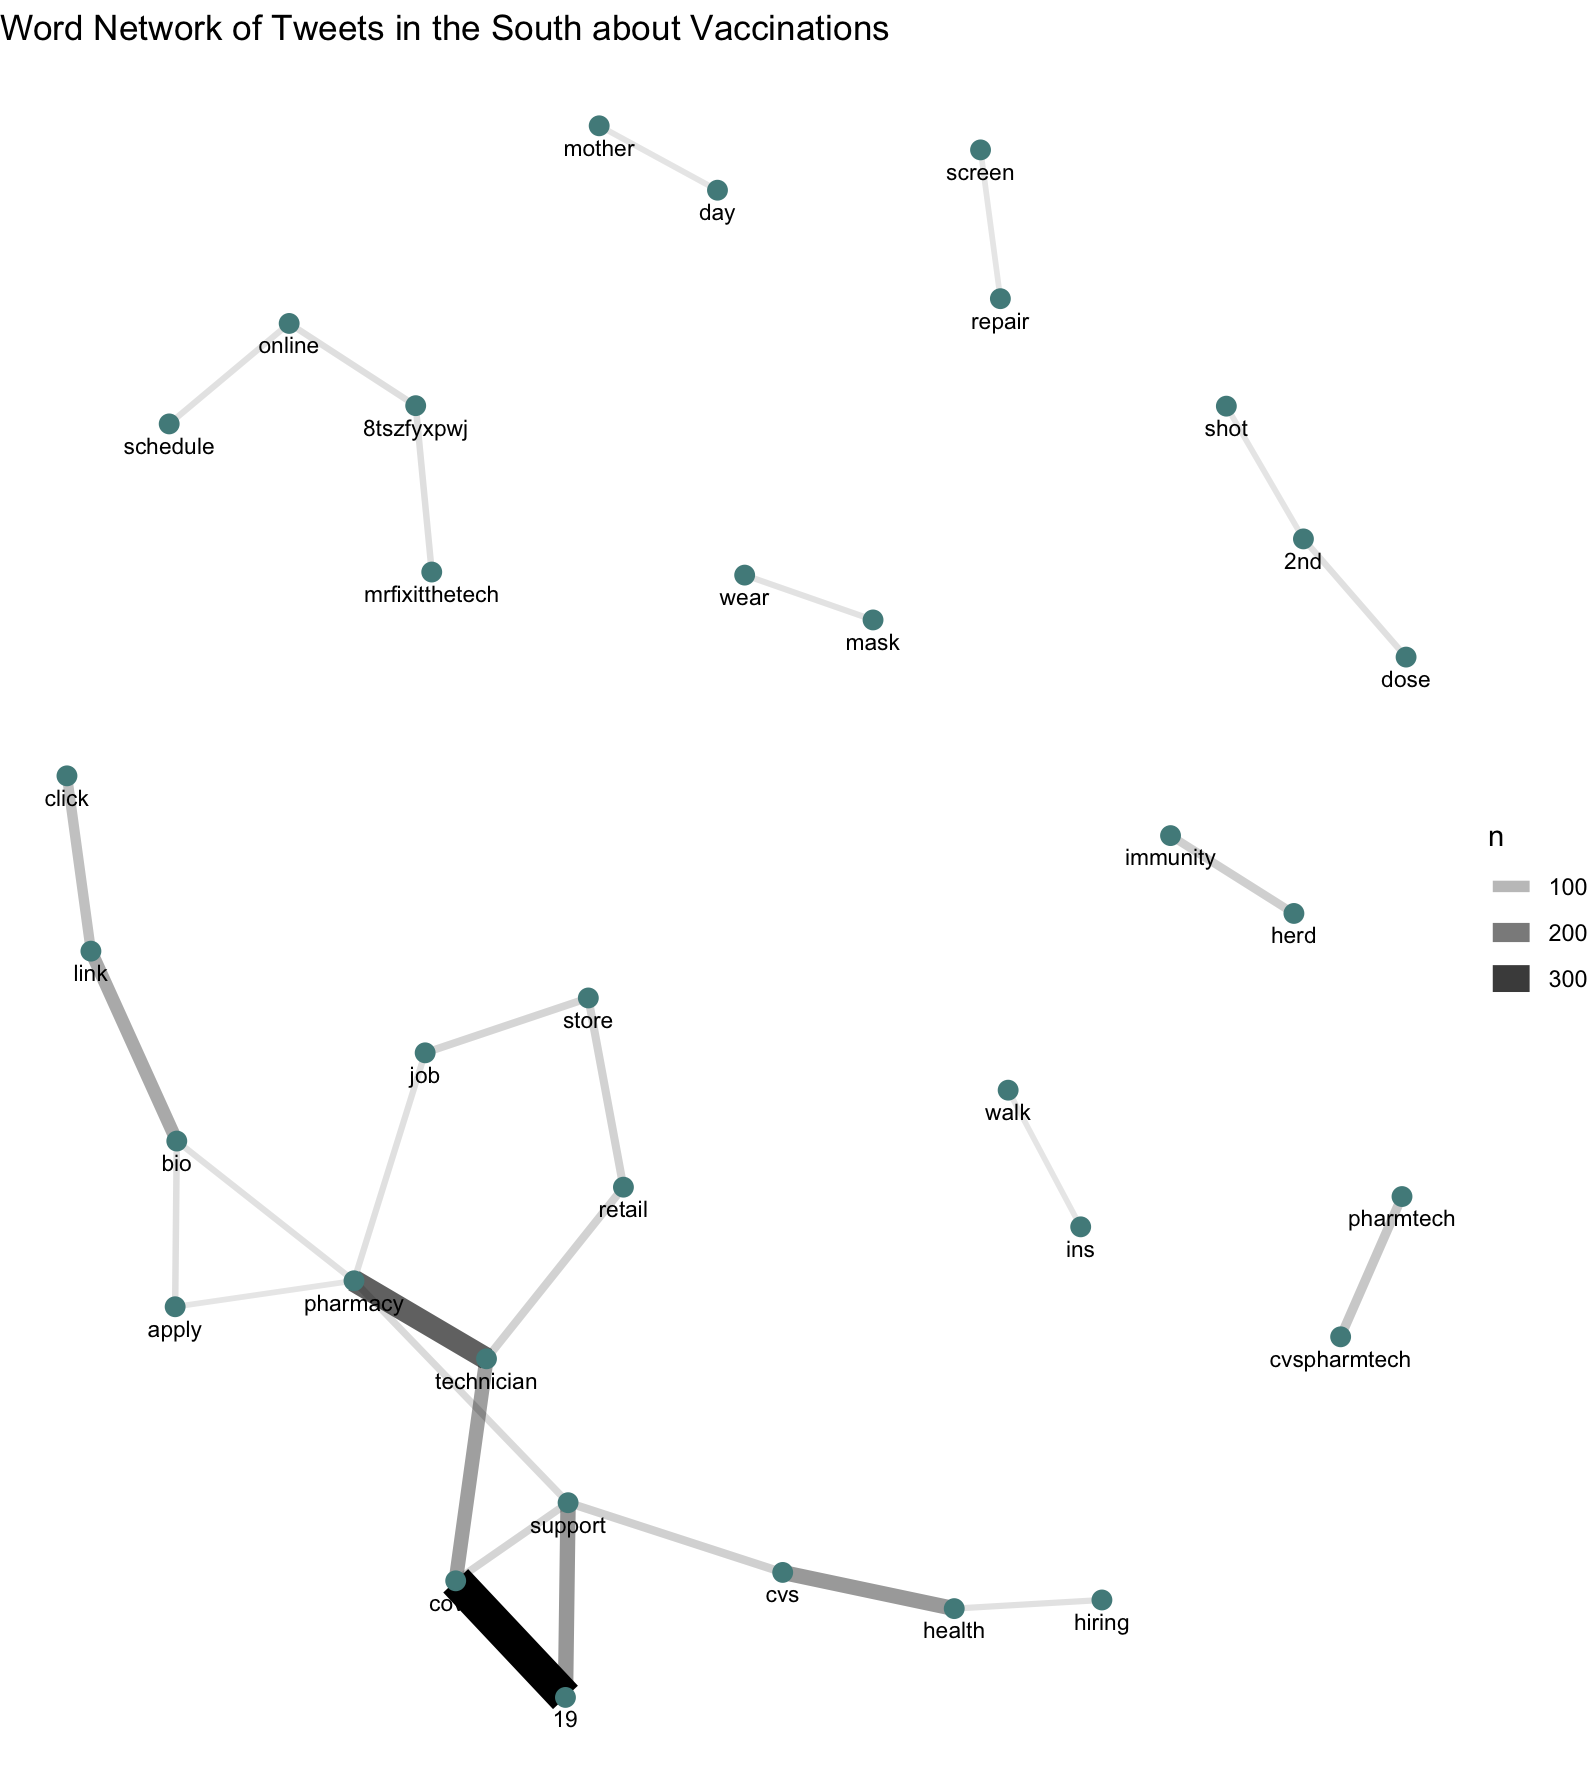 figure 3. Word cloud network, revealing word pairs commonly found within vaccination related Tweets
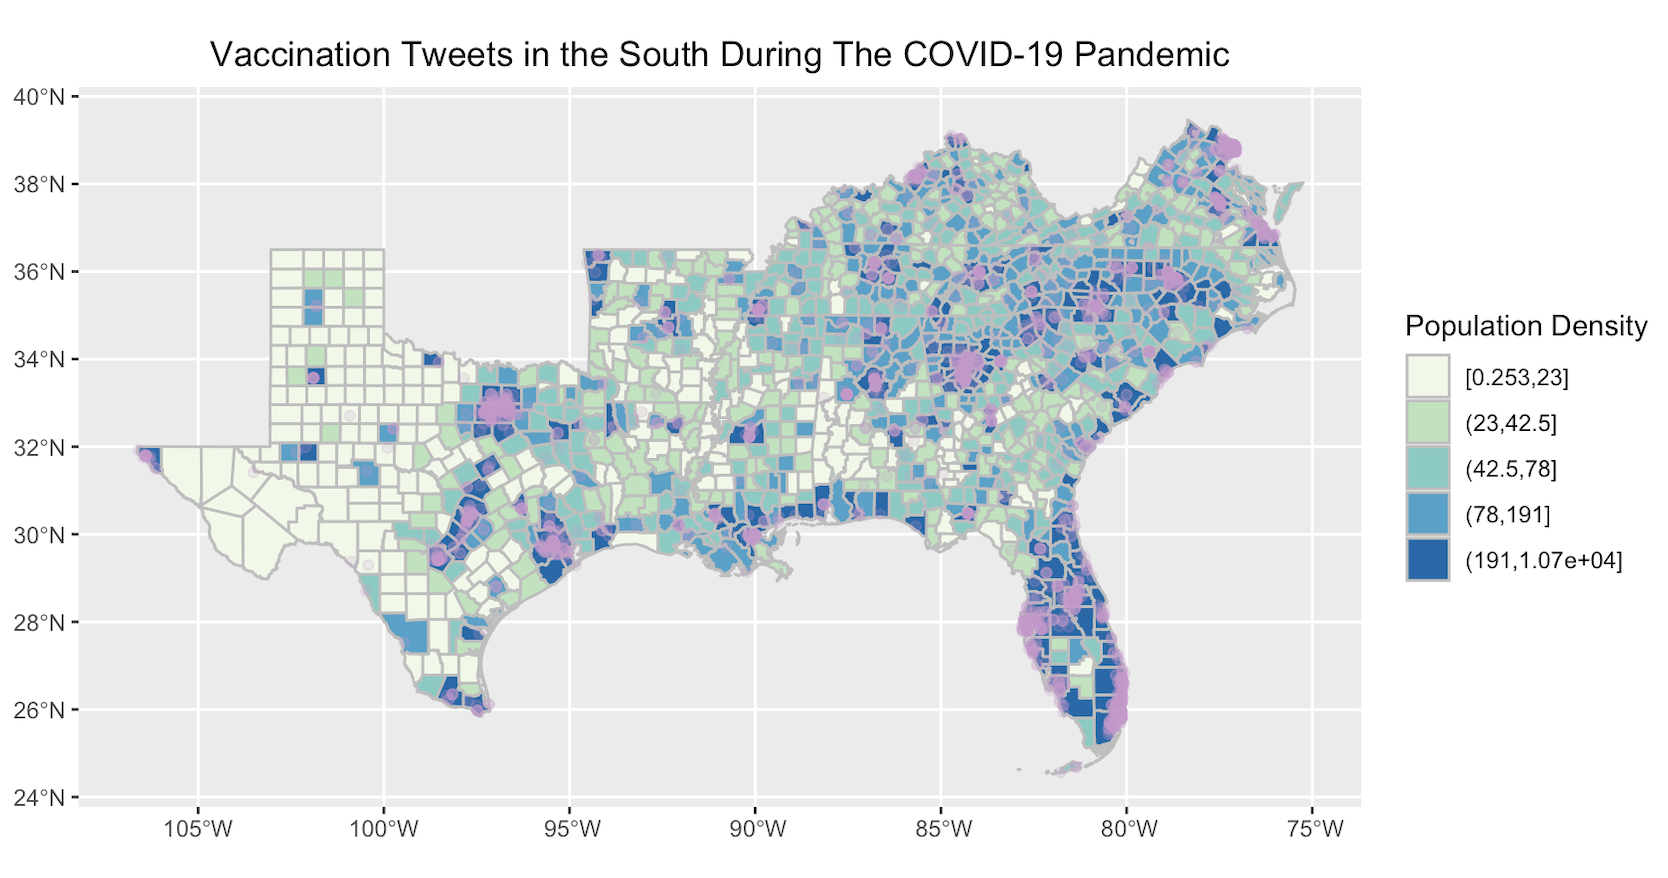 figure 4. Location of vaccination Twitter activity in the South
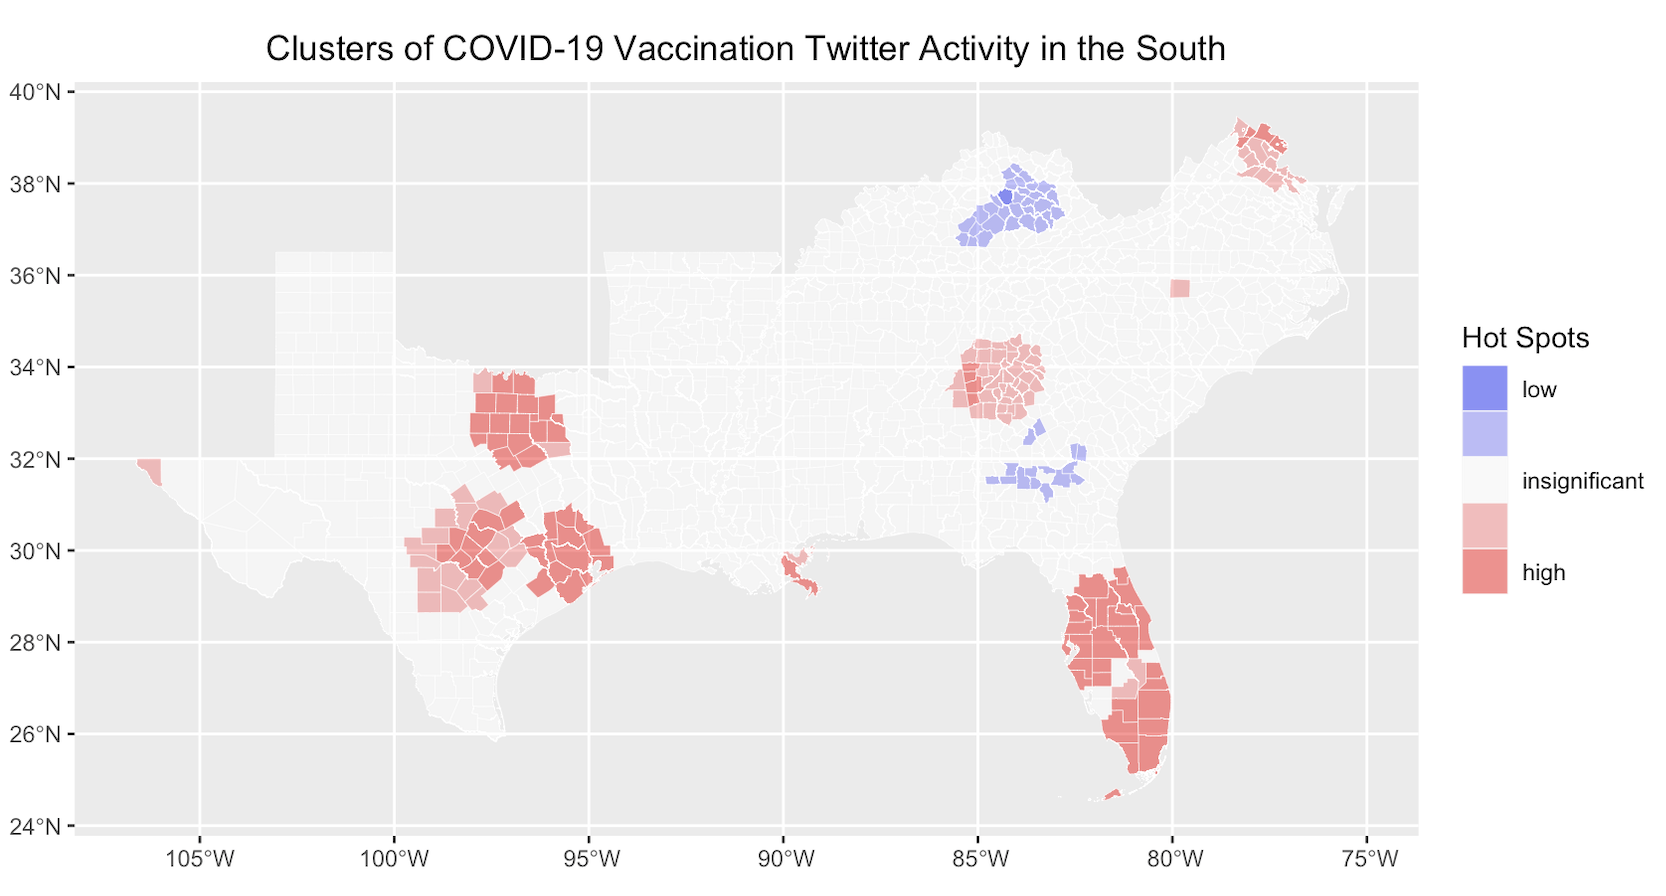 figure 5. Location of hot & cold spots of vaccination Twitter activity in the South by county
Unplanned Deviations from the Protocol
In order to visualize vaccination related Twitter activity in the South, R code was implemented to bound/inner-join vaccination Tweet points to the counties of southern states only, rather than the entire US. Hence, 2,805 Tweets of the 4,985 previously filtered Tweets were used in my spatial & cluster analyses. This deviation also removed Tweets on the outer edge of the 1000mi search radius that could have distorted the scale of my analysis. This step was accomplished after the my content and temporal analyses, making figures 1 to 3 applicable on a national scale and giving figures 4 & 5 regional specificity. Otherwise, no significant deviations were made from the protocol established by Holler (2021).
Discussion
The temporal distribution of vaccination related Tweets across my study period appears to have steadily declined, with spikes in Tweets happening on May 5th and May 4th trailing behind (figure 1). On May 4th, President Biden gave a briefing room update on the COVID-19 response team’s vaccination program, outlining three areas of focus in the coming months: providing children/adolescents ages 12-15 access to the vaccine, making vaccines more accessible and convenient to the general public, and boosting American’s trust and confidence in getting the vaccine. Together, these focus areas of the briefing became topics of the news outlets that day, from CNN to the New York Times, which likely resulted in greater Tweet activity the following day. Here, a temporal lag was noted similar to that of Wang et al’s (2016) temporal analysis, however, not by significant margin.
Looking at the text/content analysis, the fact that “covid” and “19” were the first and third most common words found in vaccination Tweets affirms that “people” (the second most common term) are getting/looking to get “vaccinated” (the fourth most common term) for the coronavirus, and that Tweets about vaccinations/appointments aren’t predominately for other medical topics (i.e. an eye-doctor appointment or the flu-vaccine) (figure 2). As well, it appears that “pharmacy,” “technician,” and “job” were also frequently occurring words in vaccination Tweets, suggesting there was a demand for pharmacy technicians to help administer vaccines, given the increased rollout of vaccine supply from the Biden administration. Figure 3 reiterates and supports these findings, as the terms “hiring,” “health,” “cvs,” “support,” “technician,” “pharmacy,” and “job” are all part of the same word web. Other interesting finds from word cloud were that “click,” “link,” and “bio” were a word series in the same word web previously mentioned, suggesting people were spreading the message about applying for pharmacy technician positions. However, I’d also assume “click link [in] bio” would also be used to help others make vaccination appointments online. More minor word pairs such as “wear” & “mask,” “herd” & “immunity,” and “walk” & “ins” implies there’s general ‘positive’ sentiment towards preventing the spread of the virus and encouragement to get vaccinated in hopes of returning to normal.
The locations of vaccination Twitter activity in the South follow the patterns observed by Wang et al (2016) and Holler (2021), where more densely populated areas were the sites of increased Twitter activity (figure 4). However, an important consideration to make in my case study is the geopolitical context of these places, as more urbanized and developed areas of the South tend to house more liberal demographics—an influential factor affecting who’s tweeting and not tweeting about COVID-19 vaccinations. Unlike natural hazards, there’s a higher degree of polarization/selectivity when tweeting about the pandemic. Lastly, when normalized for baseline Twitter activity, the clusters of COVID-19 vaccination Twitter activity in the South (figure 5) reveal while hot spots still exist in urbanized areas of Texas and south Florida, as you look to states such as Alabama, Mississippi, and Louisiana, these localities experienced lower vaccination related Twitter activity. This is no coincidence given these states are in the bottom half of states for percentage of COVID-19 vaccines administered as of May 17th (coming in 51st, 50th, and 33rd respectively). The most major cold spot, however, was in Kentucky. Although the state ranks 16th for percentage of vaccinations administered, the cold clustering of vaccination related Twitter activity can be attributed an older, rural, and conservative population that’s either detached from Twitter or engaging in other less relevant Twitter activity (i.e. tweeting about Mother’s Day or the Kentucky Derby).
Conclusion
In this replication of Wang et al (2016) & Holler (2021), vaccination related Tweets from the week leading up to May 10, 2021 were most frequent on May 5th, following a consistent temporal pattern overall. Based on a text/content analysis of the Tweets, three common trends emerged: vaccinations/vaccine appointment pertained to COVID-19, pharmacy technicians were in demand as a result of increased vaccine roll out, and citizens shared a more positive sentiment towards getting vaccinated/stopping the spread of COVID-19. The spatial analysis revealed a higher concentration of vaccination related Tweets in areas of the South with greater population densities, while slight deviations emerged in the cluster analysis, spotlighting regional variations in vaccination Twitter activity when normalized by population.
Whereas Wang et al (2016) & Holler’s (2021) work focused on analyzing Twitter data for natural hazards (wildfires and hurricanes), my replication looked at Twitter data in the context of public health/medicine, showing how the applications of spatial, temporal and content analyses have limitless potential and extend beyond the lens of natural hazards. For future geospatial research, further investigation of the relationship between spatial and temporal patterns of Twitter activity could help inform how real-world events in our everyday lives bridge with our digital landscape. For example, do Tweets about natural disasters experience a delay after occurrence, or does Twitter activity about rediscovered species (a different parameter) experience the same type of temporal lag as observed in Wang et al (2016)? Thus, inquiries like these will continue to push the envelop on big data research and shed light on the robust/informative strengths Twitter data has in making sense of everyday events and generational topics.
References
Chatlani, S. 2021. Vaccination Rates Lag In 3 Gulf States: Alabama, Mississippi, Louisiana. National Public Radio. https://www.npr.org/2021/05/12/996079225/vaccination-rates-lag-in-3-gulf-states-alabama-mississippi-louisiana
Crawford, K., and M. Finn. 2014. The limits of crisis data: analytical and ethical challenges of using social and mobile data to understand disasters. GeoJournal 80 (4):491–502. DOI:10.1007/s10708-014-9597-z
Fox, M. (2021, May 4). FDA to authorize Pfizer’s Covid-19 vaccine for 12-to-15-year-olds by early next week, official says. CNN Health. https://www.cnn.com/2021/05/03/health/pfizer-covid-vaccine-teens-fda/index.html
Holler, J. 2021. Hurricane Dorian vs Sharpie Pen: an empirical test of social amplification of risk on social media.
NASA. (2000, August 30). Measuring Vegetation (NDVI & EVI). NASA Earth Observatory; NASA Earth Observatory. https://earthobservatory.nasa.gov/features/MeasuringVegetation/measuring_vegetation_2.php
Oh, S. (2016, September 30). Which states count as the South, according to more than 40,000 readers. Vox Media. https://www.vox.com/2016/9/30/12992066/south-analysis
Ord, J. K., and A. Getis. 1995. Local Spatial Autocorrelation Statistics: Distributional Issues and an Application. Geographical Analysis 27 (4):286–306. DOI:10.1111/j.1538-4632.1995.tb00912.x
Wang, Z., X. Ye, and M. H. Tsou. 2016. Spatial, temporal, and content analysis of Twitter for wildfire hazards. Natural Hazards 83 (1):523–540. DOI:10.1007/s11069-016-2329-6.
Wolfe, J. (2021, May 4). Coronavirus Briefing: What Happened Today. The New York Times. https://www.nytimes.com/2021/05/04/us/coronavirus-today-vaccine.html
Report Template References & License
This template was developed by Peter Kedron and Joseph Holler with funding support from HEGS-2049837. This template is an adaptation of the ReScience Article Template Developed by N.P Rougier, released under a GPL version 3 license and available here: https://github.com/ReScience/template. Copyright © Nicolas Rougier and coauthors. It also draws inspiration from the pre-registration protocol of the Open Science Framework and the replication studies of Camerer et al. (2016, 2018). See https://osf.io/pfdyw/ and https://osf.io/bzm54/
Camerer, C. F., A. Dreber, E. Forsell, T.-H. Ho, J. Huber, M. Johannesson, M. Kirchler, J. Almenberg, A. Altmejd, T. Chan, E. Heikensten, F. Holzmeister, T. Imai, S. Isaksson, G. Nave, T. Pfeiffer, M. Razen, and H. Wu. 2016. Evaluating replicability of laboratory experiments in economics. Science 351 (6280):1433–1436. https://www.sciencemag.org/lookup/doi/10.1126/science.aaf0918.
Camerer, C. F., A. Dreber, F. Holzmeister, T.-H. Ho, J. Huber, M. Johannesson, M. Kirchler, G. Nave, B. A. Nosek, T. Pfeiffer, A. Altmejd, N. Buttrick, T. Chan, Y. Chen, E. Forsell, A. Gampa, E. Heikensten, L. Hummer, T. Imai, S. Isaksson, D. Manfredi, J. Rose, E.-J. Wagenmakers, and H. Wu. 2018. Evaluating the replicability of social science experiments in Nature and Science between 2010 and 2015. Nature Human Behaviour 2 (9):637–644. http://www.nature.com/articles/s41562-018-0399-z.